IOT Timestream data with Grafana
Hello People. This article discusses about IOT Timestream data with Grafana. With AWS now offering managed services for IoT ingress, time series data storage and Grafana, the integration and security challenges are largely solved.
Grafana allows you to query, visualize, alert on, and understand metrics. With Grafana, you can create, explore, and share dashboards, fostering a data-driven culture. Grafana allows you to define thresholds visually and get notified via Slack, PagerDuty, and more. Grafana supports dozens of data sources, including MySQL, PostgreSQL, Elasticsearch, InfluxDB, TimescaleDB, Graphite, Prometheus, Google BigQuery, GraphQL, and Oracle. Grafana is extensible through a large collection of plugins.
Are you looking to start your business in the electric vehicle industry? We provide software development, web application development, mobile application development, charging stations management app, electric vehicle fleet management software development, cyber security and all software services. Please check our home page here https://iwheels.co/

Ok. Let's get back to the article.
Setting up Grafana Instance
Setting up and configuring Grafana starts once you click on “Create Workspace” on AWS. AWS uses SSO for access control - this is powered by AWS Organizations behind the scenes. IAM policies can be enabled with a click or you can configure these yourself.
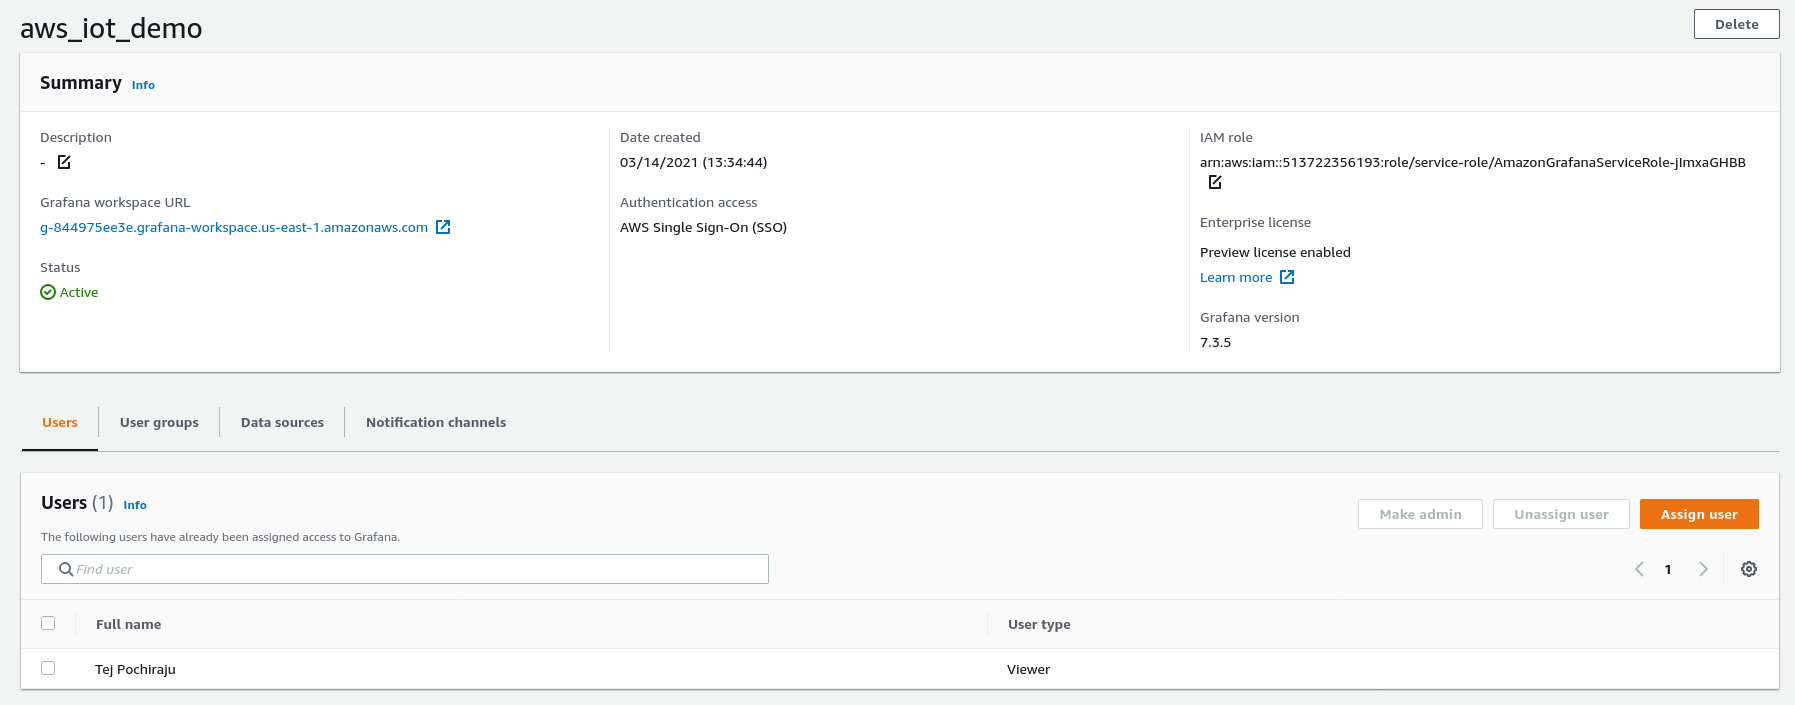
Once we are done with the setup wizard, we enable the newly created user for access. In a couple of minutes our brand new Grafana instance is ready for use. We are brought to this friendly and useful summary.
Accessing Grafana
Now AWS has created a new Organisation, sent a confirmation email to the logged in IAM user and another invitation email to the SSO user we created. Accepting the invitation allows us to set up a password for this user which we will need when accessing the Grafana instance. Once we login, the interface is an AWS white-labeled version of the standard Grafana UI with a section for AWS specific data sources. Finding and setting up our Timestream DB as the default data source is also a matter of a few clicks.
The combination of Prometheus and Grafana is a common monitoring stack used by DevOps teams for saving and visualizing time series data. An open source solution for running data analytics and monitor applications with the help of customizable dashboards, Grafana works as the interface for analysis and visualization while Prometheus is used for event monitoring and real-time alerting, recording metrics in a time series database.
Hope this article about IOT Timestream data with Grafana is useful to you. Please read about Tata power EV charging stations in Andhra Pradesh